The upgraded system for electron spectrometer control and spectra acquisition
Spectrum2
The software is aimed to control electron spectrometers through the Egor Tikhonov’s interface board. It is
a deep modernization of his Spectrum software with a wide expansion of spectrometer abilities
provided by the hardware ESCALAB Mk2 and similar spectrometers.
Main changes:
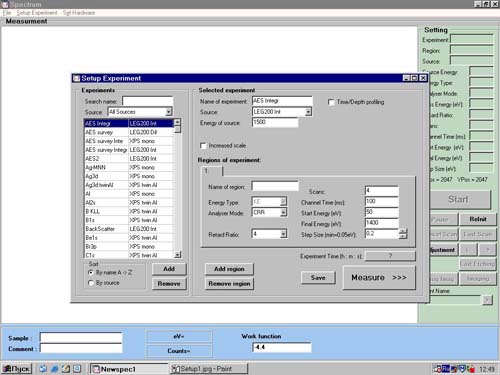
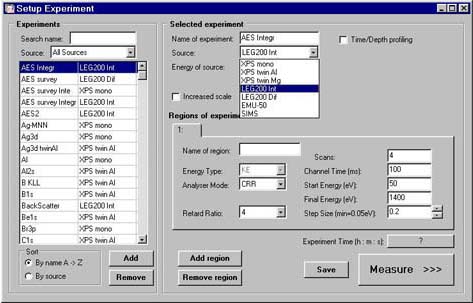
Setup Experiment
- The set of sources was changed:
- XPS (with the choice of recording spectra in kinetic (KE) or binding (BE) energies
- Scanning Auger gun LEG200 with electrons kinetic energies spectra acquisitionс in N(E) or dN/dE
modes
- Source of monochromatic low energy electrons EMU50 could provide spectra in the main (0.05 eV
energy step) or high или высокого (0.0025 eV energy step) analyzer resolution modes. This mode could
be used also for Ultraviolet Photoelectron Spectroscopy (UPS)
- Secondary ions mass-spectroscopy with the AG61 scanning ion gun source and SQ300 mass-spectrometer
- Depending on the selected analyzer mode CAE/CRR the Pass energy/Retard ratio value is indicated
- Experiment duration time calculator is added
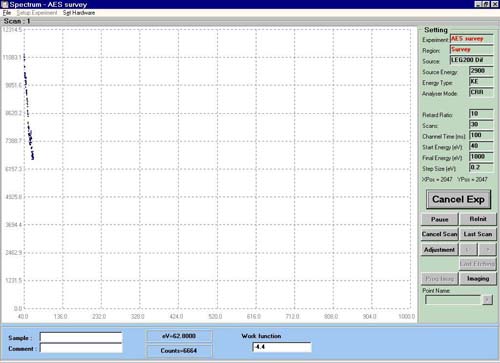
Spectrum
- The software-hardware interaction logic was rectified; errors in electrons energy settings were
corrected
- To decrease total experiment duration due to equipment relaxation delay, the spectra recording is now
bi-directional: the odd scans are recorded with energy increasing while the even ones in reverse direction
- The Adjustment mode was added to adjust the sample position on the characteristic line maximum
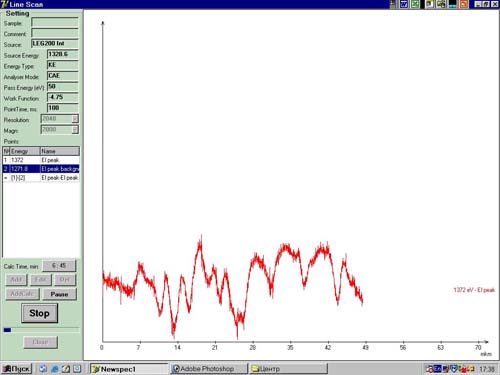
- Using the LEG200 source with spectra recording in the integral or differential mode one can to program
Imaging selecting energies on the recorded spectrum to acquire images or go directly to Imaging
window with current spectrometer settings.
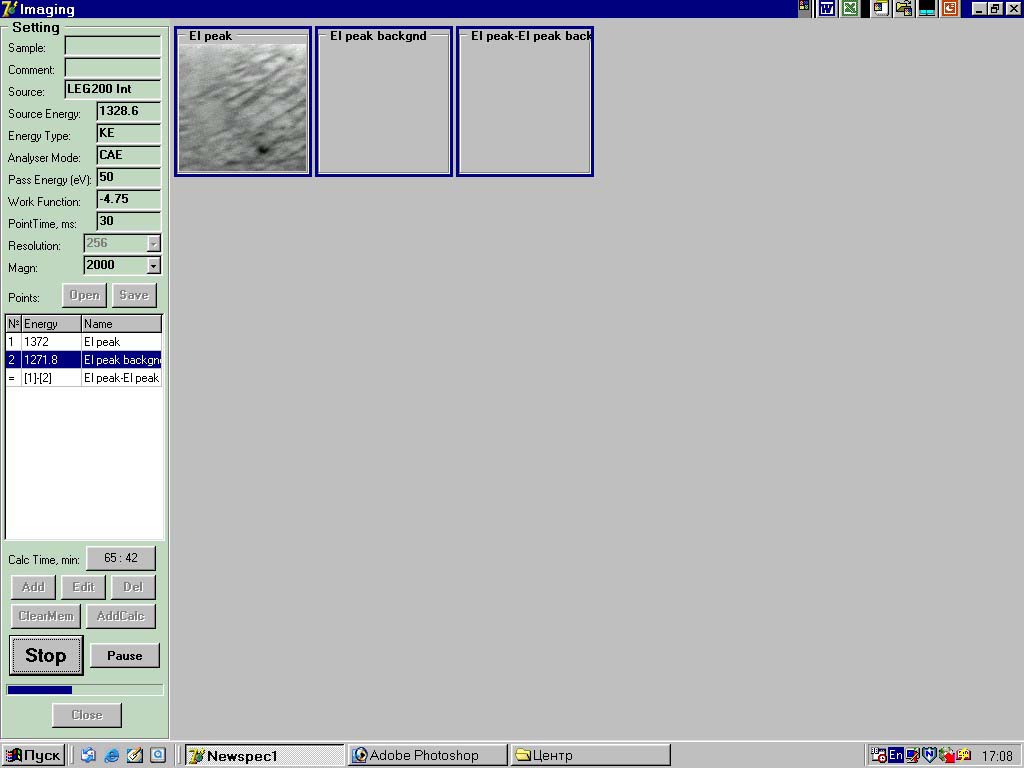
Imaging и LineScan
These are the novel program functions that are exploiting all functionalities of the ESCALAB Mk2
electronic assemblies.
In addition to recording electrons intensities with specific energies in the area or along the scanning
line the simplest data processing operations are available:
- Difference of intensities in the same points recorded at two energies Icorr = I2
– I1 to visualize the differential Auger line amplitude distribution
- Topographic contrast compensation for images recorded in the N(E) mode Icorr = (P – B)/B
- Normalization of secondary characteristic peaks such as peak of plasmon losses onto the primary peak
intensity Icorr = Ipl/IEl

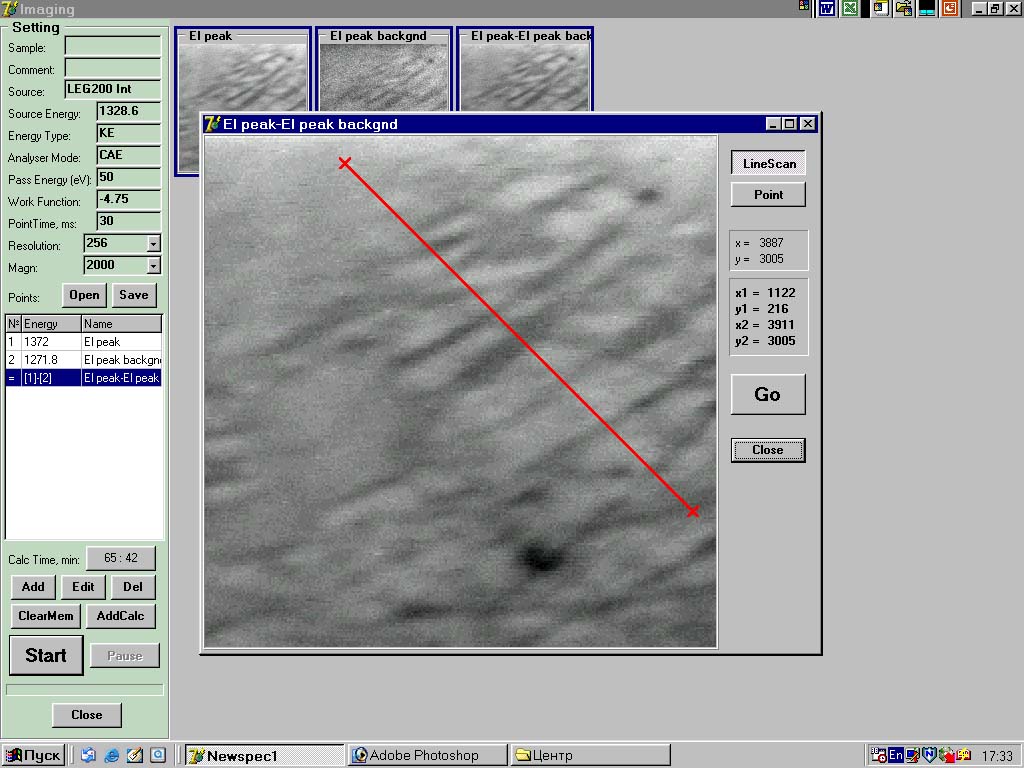
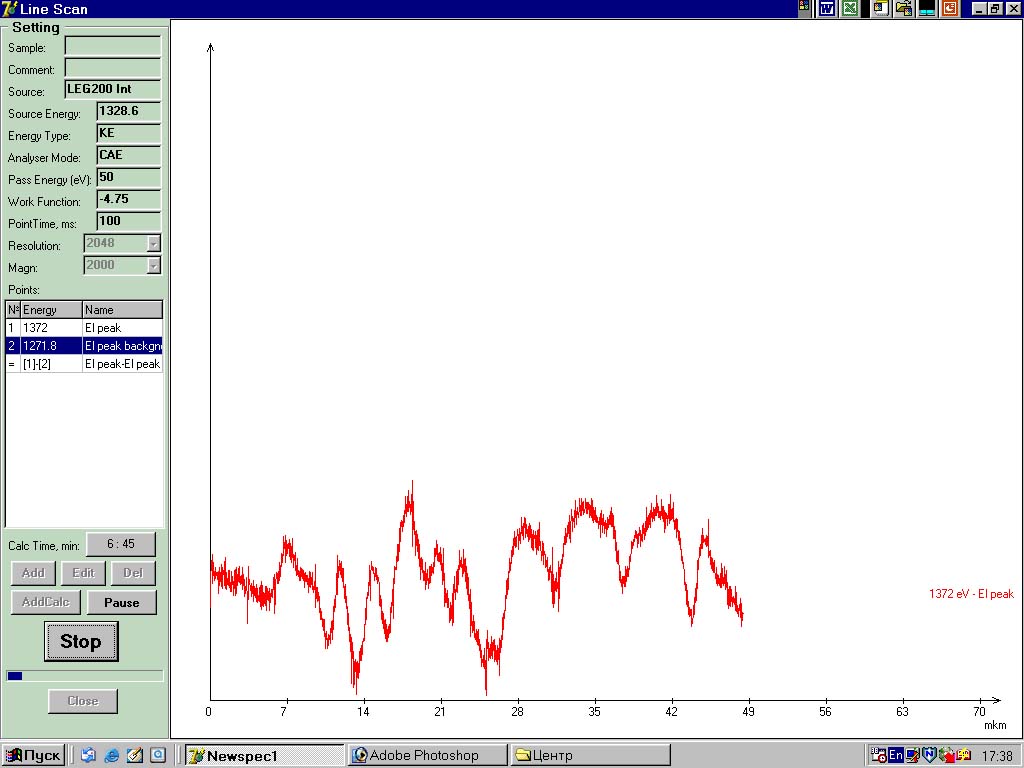
It is possible to determine a scan line to analyze intensities of characteristic peaks along it with
better resolution and exposition as well as to select most interesting points for quantitative Auger
analysis on one of pictures obtained in Imaging.